2026 Boulder Budget - Sales Tax
Boulder sales tax revenue is flat and is anticipated to decline in coming years.
Sales tax is the largest source of revenue in the city budget, funding a broad range of programs. In recent years sales tax growth has slowed peaking in 2023.
Data provided by the city [1] shows revenue by location. Graph 1 shows sales/use tax collections:
- Inside the city of Boulder peaking in 2022 at $86.2M
- Outside the city (online, catalog and other sales) rising 86% to $51.5M in 2024.
- In Gunbarrel - peaking in 2023 at $8M
- From the County Clerk (auto sales) - flat at $6M
- All other Boulder rising 47% to $14M
For a city like Boulder that has traditionally been a regional retail hub, to have declining sales within the city is a troubling trend. There are several causes that are worth considering:
- The loss of businesses due to changes in land use that pushes housing into areas previously zoned for commercial and industrial.
- Changes to transportation and land use that drive consumers out of the city
- Social issues that make shopping in Boulder a less desirable proposition.
- The transition from brick and mortar to online shopping.
In the face of declining sales tax the city is on a path to create new funding sources through fees on property instead of consumption. The 2026 budget proposes a Transportation Maintenance Fee.
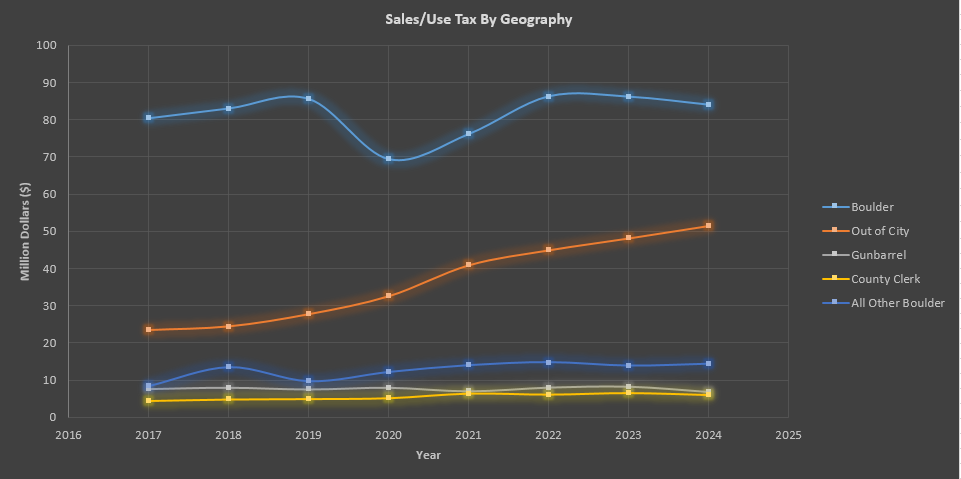
Graph 1 - Sales/use tax 2017 to 2024.
| Location | Change | Notes |
|---|---|---|
| Downtown Extension | -73% | |
| Unlicensed Receipts | -28% | |
| Downtown | -22% | |
| North Broadway | -19% | |
| Gunbarrel Industrial | -16% | |
| 29th Street | -15% | |
| Table Mesa | -8% | |
| East Downtown | -7% | |
| UHGID (the "hill") | -1% | |
| BVRC-Boulder Valley Regional Center | 6% | |
| Boulder Industrial | 6% | |
| Basemar | 7% | |
| Pearl Street Mall | 8% | |
| N. Broadway Annex | 9% | |
| N. 28th St Commercial | 10% | |
| Gunbarrel Commercial | 16% | |
| Boulder County | 16% | In county sales |
| County Clerk | 20% | Automobile Sales |
| The Meadows | 21% | |
| Public Utilities | 22% | Phone, power, cable & trash |
| Metro Denver | 43% | Sales outside the city |
| Colorado All Other | 46% | In state sales |
| All Other Boulder | 47% | |
| Out of State | 107% | Online Sales |
| CU | 280% | |
| Airport | 423% |
Table 1 - Change in sales/use tax collection from 2019 to 2024.
| Location | 2017 | 2018 | 2019 | 2020 | 2021 | 2022 | 2023 | 2024 |
|---|---|---|---|---|---|---|---|---|
| 29th Street | 8,651,725 | 8,955,329 | 8,546,119 | 5,216,325 | 6,246,298 | 7,639,742 | 7,415,024 | 7,239,305 |
| Airport | 3,728,786 | 111,924 | 59,710 | 1,495,457 | 978,735 | 690,106 | 409,586 | 312,373 |
| Basemar | 1,988,758 | 2,061,487 | 3,173,527 | 2,837,021 | 2,795,146 | 2,716,803 | 2,782,302 | 3,391,102 |
| Boulder County | 1,468,971 | 1,583,414 | 1,978,914 | 2,299,945 | 2,026,791 | 2,387,944 | 2,654,259 | 2,296,950 |
| Boulder Industrial | 13,310,534 | 12,908,478 | 13,408,482 | 12,452,067 | 14,082,481 | 16,663,655 | 16,450,149 | 14,231,824 |
| BVRC | 25,349,357 | 27,509,019 | 26,175,738 | 23,607,630 | 26,264,713 | 27,980,828 | 26,611,836 | 27,639,259 |
| Colorado All Other | 611,448 | 633,660 | 686,962 | 757,997 | 551,770 | 840,242 | 971,942 | 1,000,958 |
| County Clerk | 4,496,393 | 4,853,318 | 4,968,493 | 5,176,514 | 6,318,622 | 6,072,556 | 6,447,628 | 5,965,968 |
| Downtown | 10,836,431 | 10,668,497 | 12,467,154 | 5,693,484 | 7,701,947 | 9,412,975 | 9,504,961 | 9,766,695 |
| Downtown Extension | 720,573 | 507,259 | 685,965 | 659,656 | 473,973 | 307,168 | 205,679 | 186,453 |
| East Downtown | 970,443 | 1,211,990 | 994,318 | 784,687 | 946,364 | 1,034,859 | 1,118,458 | 921,858 |
| Gunbarrel Commercial | 1,604,237 | 1,563,490 | 1,546,710 | 1,578,391 | 1,733,810 | 1,765,474 | 1,763,582 | 1,791,858 |
| Gunbarrel Industrial | 5,986,618 | 6,406,721 | 5,933,283 | 6,382,921 | 5,215,182 | 6,245,412 | 6,496,792 | 4,974,228 |
| Metro Denver | 4,574,460 | 4,932,702 | 5,599,850 | 5,406,203 | 6,594,850 | 7,040,145 | 7,810,551 | 8,025,706 |
| N. 28th St Commercial | 6,472,008 | 6,522,935 | 6,714,738 | 6,763,807 | 6,584,643 | 7,671,286 | 8,517,821 | 7,399,656 |
| N. Broadway Annex | 428,298 | 484,903 | 667,765 | 1,168,339 | 463,736 | 510,523 | 657,821 | 728,909 |
| North Broadway | 1,820,062 | 1,741,708 | 2,470,680 | 2,211,518 | 2,187,335 | 2,180,959 | 2,107,847 | 1,991,606 |
| Out of State | 16,687,646 | 17,181,611 | 19,379,594 | 24,039,687 | 31,702,841 | 34,651,992 | 36,706,479 | 40,191,579 |
| Pearl Street Mall | 4,226,833 | 4,517,234 | 4,115,749 | 2,631,546 | 4,018,088 | 4,474,766 | 4,684,468 | 4,457,268 |
| Public Utilities | 4,860,064 | 4,761,626 | 4,798,040 | 4,517,893 | 5,157,332 | 6,129,682 | 6,191,623 | 5,870,551 |
| Table Mesa | 2,942,407 | 3,286,929 | 3,340,234 | 2,952,136 | 1,607,388 | 2,770,992 | 3,030,401 | 3,065,580 |
| The Meadows | 1,131,452 | 1,026,505 | 1,133,578 | 1,194,512 | 1,400,436 | 1,506,065 | 1,582,864 | 1,374,339 |
| UHGID (the "hill") | 1,486,253 | 1,542,317 | 1,571,509 | 1,216,120 | 1,367,732 | 1,340,197 | 1,423,512 | 1,555,138 |
| CU | 1,300,466 | 1,303,749 | 1,276,203 | 1,302,219 | 1,231,646 | 1,689,662 | 5,657,207 | 4,853,519 |
| Unlicensed Receipts | 359,258 | 962,508 | 501,334 | 680,925 | 713,780 | 667,526 | 491,054 | 359,055 |
| All Other Boulder | 8,525,411 | 13,409,397 | 9,760,001 | 12,168,411 | 13,937,014 | 14,721,057 | 13,823,284 | 14,316,693 |
| Total Sales and Use Tax | 134,538,892 | 140,648,710 | 141,954,650 | 135,195,411 | 152,302,653 | 169,112,616 | 175,517,130 | 173,908,430 |
Table 2 - Sales/Use tax collection by geography (2017-2024)
Sources